 in the Podium and enter a single form


The Stepper tool allows you to follow the execution of your program, displaying the source code as it executes. While stepping, you can see the evaluation of each subform, function call and the arguments and return values in each call. At every call to one of your functions, you have the option of stepping into that function, that is stepping the source code definition of the function.
Where a macro appears in stepped code, the Stepper can macroexpand the form and step the resulting expansion, or simply step the visible inner forms of the macro form. Where a special form such as if appears in stepped code, the Stepper processes it according to the execution order in that special form.
The system creates a Stepper tool automatically when your code reaches a breakpoint
Other ways to start a Stepper tool are:


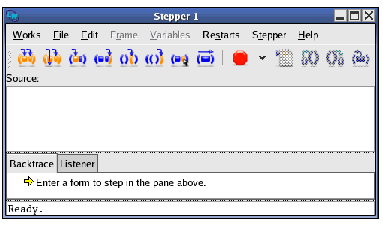
The commands on the stepper toolbar allow you to step to various points in the code, set breakpoints and perform macro expansions.
This is an editor window where you can enter the initial form to step. It also displays a read-only copy of a definition that you step into.
The title of the source area may be Source: or Source file: path or Old copy of source file: path or Buffer: buffer-name , depending on where the original source code is.
Notice that the editor cursor is an underline in the source area. This is because the normal cursor styles are not visible where the Stepper is highlighting a form.
The Backtrace tab displays the function calls on the execution stack in the code being stepped.
The topmost item in the backtrace area shows the next step, known as the status. When calling a function, the status item is represented by a  icon and contains the arguments represented as subnodes with a yellow disc
  icon. When returning from any form, the status item is represented by a
  icon and contains the return values. When evaluating a form, the status item is represented by a
  icon. You can see the contents of the status item by expanding it. You can make the status item expand automatically if you wish, as described in Backtrace preferences.
The second topmost item in the backtrace area is the active frame represented by a  icon. This shows the function executing when the breakpoint was reached, and its arguments which are represented as subnodes with a yellow disc
  icon.
icon.
Other call frames on the stack are represented in the same way, below.
A subnode with a cyan disc  icon represents some other frame.
For function calls, arguments and local variables can be seen by expanding the item. You can make the active frame expand automatically if you wish, as described in Backtrace preferences. Just as in the Backtrace area of the Debugger tool, these stack frames and variables can be operated on using the Frame and Variables menus. For details, see Backtrace area.
Double-click on a status or call frame node to show the source of that function, if available, in the Editor. Double-click on the disc icons to show that variable in the Inspector.
The Listener tab provides a Listener in which the execution steps are indicated. Commands can be entered here as an alternative to using the buttons on the Stepper toolbar.
Any form entered here is evaluated on the dynamic environment of the function being stepped.
Moreover, you can use the debugger commands such as :v, which prints the local variables in the current frame. You can use the value of a local variable simply by entering its name as shown. See the
LispWorks User Guide and Reference Manual
for more details about the debugger commands.
See Listener area for more details.
LispWorks IDE User Guide (Unix version) - 12 Feb 2015