


The profiler provides a way of monitoring Lisp functions during the execution of source code. The data that you obtain can be used to improve the efficiency of your code by highlighting procedures which are commonly used or are particularly slow, and which would therefore benefit from extra optimization effort.
To create a profiler, choose Tools > Profiler .
The profiler has several areas. The Code to Profile panel lets you set up and profile any amount of Lisp source code.
The Results area is used to display the results of a profile.
In the next figure, the Packages button was first used to view the package filter selection dialog box (shown in Figure 18.3); all packages except from COMMON-LISP-USER were deselected. By default, all packages are selected. When trying to profile code without a user interface, it is especially important to deselect the package CAPI.
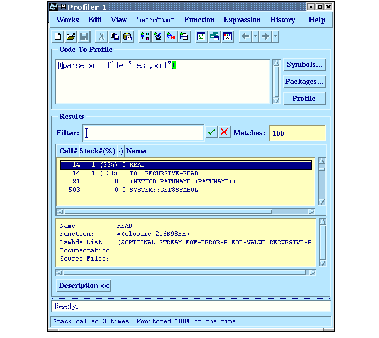

You can toggle the visibility of a description pane by clicking on the Description button . The Description area provides a description of any item selected in the Results area, giving you the name, function, lambda list, documentation string and source files of the selected item.