(defun test ()
(let ((total 0))
(loop for i below 100 do
(incf total i) when (= i 50) do
(break "We've reached fifty"))))
This function counts from 0 to 100, accumulating the total as it progresses, and forces entry into the debugger when the count has reached 50.
(test) into the listener.Initially, the command line debugger is entered. This is a debugger which can be used from within the listener itself. More details about what you can do in the command line debugger can be found by typing :? at the debugger prompt.
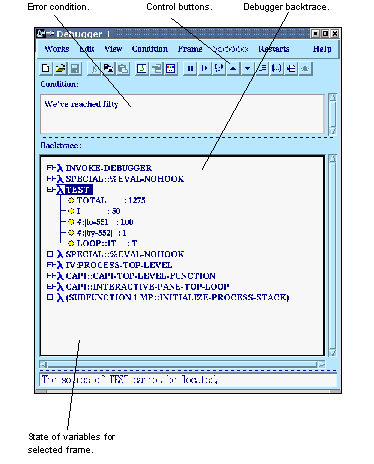
The debugger tool appears, as shown in Debugger tool.


The debugger tool gives a view of the backtrace (in the Backtrace pane), showing the functions that are on the stack, and their internal variables (including any arguments) at the point that the error occurred.
TEST if it is not already selected. Clicking on TEST opens up the tree display to show the local variables defined and used in function TEST. Notice that the value for i is 50, as you would expect.
There is a row of buttons at the bottom of the debugger which let you perform a number of different actions.


