

22.8 Some examples
The examples below demonstrate different ways in which the profiler can be configured and code profiled so as to produce different sets of results. In each example, the following piece of code is profiled:
(dotimes (x 1000)
(capi:make-container
(make-instance 'capi:title-pane
:text "Title")))
This is a simple piece of code which makes some CAPI objects.
-
Create a Profiler tool if you have not already done so.
-
Copy the code above into the box in the
Code to Profile
panel.
-
Choose
LispWorks > Preferences...
or click
 , select
Profiler
in the list on the left side of the dialog, and then select the
General
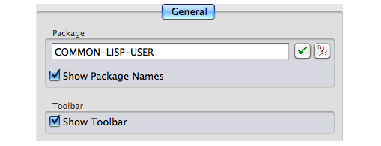
tab. Now you can change the package of the Profiler.
Figure 22.6 Profiler Preferences
-
In the Profiler Preferences, replace the default package in the
Package
text box with
CAPI
and click
 .
.
-
Click
OK
to dismiss the Preferences dialog and apply the change you have made.
-
Click on
Profile
.
This profiles the functions in the
COMMON-LISP
,
CL-USER
and
LISPWORKS
packages.
Next, add the
CAPI
package to the list of packages whose functions are profiled.
-
Click
Packages
.
-
In the dialog, double-click on
CAPI
in the
Unselected Packages
list, and click on
OK
.
-
Click on
Profile
to profile the code again.
Notice that this time there are many more functions which appear in the profile results.
-
Select a few of the functions listed at the top of the
Results
area, and look at their function descriptions.
Add the Description area by clicking the
Description >>
button if you have not already done so.
Notice that most of the functions appearing on the stack are in the
CAPI
package. It is worth profiling a few functions explicitly, and removing unwanted packages from the list of packages to profile.
-
Click
Symbols...
, and add the following four functions to the list in the dialog:
merge find-class make-char functionp
Type the name of each function and press
Return
or click
 to add it to the list.
-
Click
OK
when you have finished adding to this list.
Now remove the unwanted packages from the list of packages to profile, as follows:
-
Click
Packages...
.
-
In the dialog click on
None
to remove all items in the
Selected Packages
list
-
Click on
OK
, and profile the code again by clicking on
Profile
.
Notice that the four functions in the
COMMON-LISP
package are still being profiled, even though you are no longer profiling all functions from that package by default.
LispWorks IDE User Guide (Macintosh version) - 25 Nov 2011


 , select
Profiler
in the list on the left side of the dialog, and then select the
General
tab. Now you can change the package of the Profiler.

 .
. to add it to the list.


