


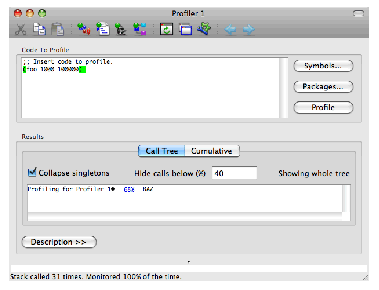
The
Call Tree
tab shows a graph of functions called by the top level function call that was profiled. Each node represents a function call. The graph edges are labelled according to the proportion of time spent in each function call. For example in The Profiler, of all the time spent in function
bar
, most was spent in
baz
and the rest in
quux
. This allows you to see which branches of the code dominate the total time spent.
When optimizing your code you will want to concentrate on the calls which take a large proportion of the time. The least significant parts of the graph are removed from the display according to the percentage in the
Hide calls below (%)
box. You can adjust this percentage simply by entering an integer and pressing
Return
.
When analysing the call tree to find the most significant branches, single callees (that is, functions which account for all of the time spent by their caller) are not interesting. You can adjust the call tree to omit these functions from the displayed graph by checking the Collapse singletons box.
Figure 22.2 The Profiler's Call Tree adjusted

You can also change the root of the graph displayed. This option is useful when you have a large call tree. To do this, select the node that you wish to make the root, and raise the context menu, and choose the Set As Root command. To display the entire call tree again, choose the Show Whole Tree command from the graph's context menu.
LispWorks IDE User Guide (Macintosh version) - 25 Nov 2011