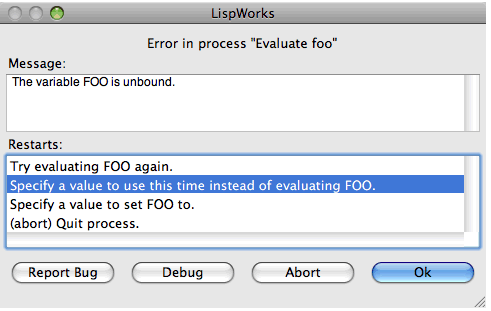


When an error is signalled in processes other than the Listener REPL, by default a Notifier window appears. This shows the error message, and allows you to choose how to proceed by offering the restarts and other options.
Figure 11.5 The Notifier window


The Notifier window has three main areas.
The Message: area displays the error message.
The Restarts: area contains a list of available restarts. To invoke a restart, select it in the list and click OK , or double-click on it in the list.
The row of buttons at the bottom of the Notifier window operate as follows:
Prompts for basic information about the bug and then creates an Editor tool containing a template bug form with a stack backtrace and other information. Use this if you believe you have found a bug and wish to report it to Lisp Support. Visit
www.lispworks.com/support/bug-report.html
for more information about reporting bugs.
Raises a Debugger tool, as described earlier in this chapter.
Invokes the abort restart.
Invokes the restart which is selected in the Restarts: list.
Some processes cannot be debugged in the LispWorks IDE. Errors in these processes are handled slightly differently in the Notifier window which has these two buttons:
Creates a snapshot Debugger. This contains a copy of the stack backtrace which you can examine as described in this chapter. However it is less interactive in that you cannot take any restart or return from a frame. For more information see "Snapshot debugging of startup errors" in the LispWorks User Guide and Reference Manual .
Creates an Editor tool containing the stack backtrace.
In this case there is no Debug button.
On Cocoa there is a process named "Cocoa Event Loop". When there is an error in this process, the Notifier has an additional pane called Error handling in Cocoa event loop .
The Error handling in Cocoa event loop allows you to control the behavior of the Cocoa Event Loop process. This is useful when you get in a situation where something causes repeated errors in the Cocoa Event Loop, which makes it very difficult to find what the problem is. In general, you should change these settings only when you are in this kind of situation, enter the snapshot Debugger and debug the problem, and when you exit the snapshot Debugger the settings are automatically reset to the normal settings.
If you change the settings, and either did not enter the snapshot Debugger or unchecked the Restore normal error processing when snapshot debugger exits button, you should restart LispWorks once you figured out what the problem is.
Buttons at the top of the Error handling in Cocoa event loop pane give you three options:
Ignore errors in explicit events
"explicit events" means events that are generated inside Lisp, normally when another process wants to tell the event loop to do something. A typical example are calls to capi:apply-in-pane-process and related functions. This option allows you to ignore such errors.
Ignore all errors in the Cocoa Event Loop.
By default, if you enter the snapshot Debugger, once you exit the normal error handling is restored. Note that the automatic restoration does not happen if you do not enter the snapshot Debugger. The Restore normal error processing when snapshot debugger exits button allows you to override this default. You should not unset the button unless it is really needed.
Note: in some cases there will be a restart which can be used to block the repeated errors. The most common example is errors inside a display-callback, which will include a restart that removes the display-callback. If there is such a restart, it is better to use it than setting the Cocoa Event Loop error handling.
LispWorks IDE User Guide (Macintosh version) - 12 Feb 2015