23.4.1 Choosing the functions to profile
It is possible to keep track of every function called when running code, but this involves significant effort in determining which functions are suitable for profiling and in keeping track of the results. To minimize this effort you should specify which functions you want to profile. The profiler checks that these functions have indeed got function definitions and are therefore suitable for profiling. For more information on the types of function that can be profiled, see Profiling pitfalls.
There are two ways of specifying functions that you want to profile:
- Choose which individual functions you want to profile.
- Choose whole packages, all of whose functions are profiled.
23.4.1.1 Choosing individual functions
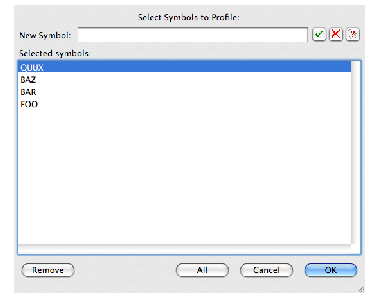
Click Symbols... to specify a list of Lisp functions that you want to profile. The dialog shown in Select Symbols to Profile dialog appears.
Figure 23.4 Select Symbols to Profile dialog


This dialog displays the list of functions to be profiled.
- To remove a function from the list, select it from the list and click Remove .
- To remove several functions, select them all before clicking Remove .
Click OK when you have finished choosing symbols.
Note: while entering the function name in the
New Symbol
text box you can click click  to use completion. This allows you to select from a list of all symbol names which begin with the partial input you have entered. See Completion for detailed instructions.
23.4.1.2 Choosing packages
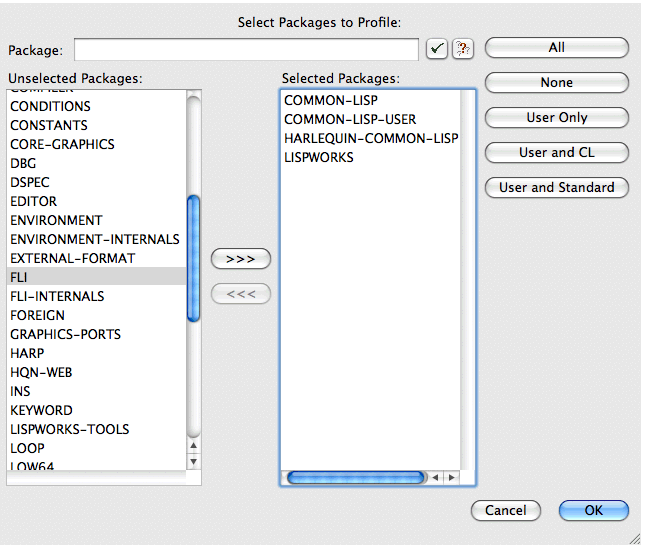
You may often want to profile every function in a package. Click Packages... to specify a list of packages whose functions you want to profile. The dialog shown in Select Packages to Profile dialog appears.
Figure 23.5 Select Packages to Profile dialog


The main part of this dialog consists of two lists:
- The Unselected Packages list shows packages in the Lisp image whose functions are not to be profiled.
- The Selected Packages list shows packages in the Lisp image whose functions are to be profiled.
A global function will be profiled if its symbol is visible in one of the selected packages.
To modify the Selected Packages list:
- Consider whether one of these buttons offers what you need, or close to it:
- Add to your Selected Packages list if necessary. You can add a single package in one of three ways:
-
Type the package name in the
Select Package
box and press
Returnor click , or
, or
Selects all packages.
Note: There are significant processing overheads when profiling all functions in all packages, and the results you get may include much unwanted information.
Adds the "user" packages, which means packages that are not part of the LispWorks implementation, or packages that are part of the implementation but you are allowed to add definitions to them. Includes the CL-USER package.
Adds the "user" and CL packages.
Adds the "user" packages along with those packages that are used by default (from the value of hcl:*default-package-use-list*, which initially includes CL, HCL and LW).
Note: The Profiler tool assumes that packages not named in the value of *packages-for-warn-on-redefinition* are user-defined.
- Select the package in the Unselected Packages list and click on the >>> button, or
- Double-click on the package in the Unselected Packages list.
- Remove packages from the Selected Packages list if necessary. You can remove a single package in one of two ways:
- Select the package in the Selected Packages list and click on the <<< button, or
- Double-click on the package in the Selected Packages list.
- Finally, click OK to dismiss the dialog when you have finished selecting the packages whose functions you want to profile, or click Cancel to cancel the operation. This also dismisses the dialog.
Also you can click the None button to clear the list of selected packages. This is useful is you only want to profile a few functions, which you can specify easily using the Symbols... button on the Profiler tool itself.


 .
. , and select
Profiler
in the list on the left side of the dialog. If you are unsure, full details on how to do this can be found in