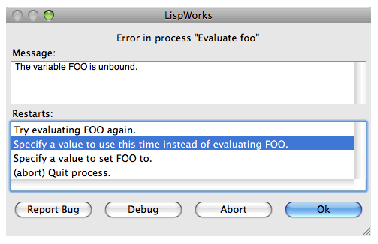


When an error is signalled in processes other than the Listener REPL, by default a Notifier window appears. This shows the error message, and allows you to choose how to proceed by offering the restarts and other options.
Figure 11.5 The Notifier window


The Notifier window has three main areas.
The Message: area displays the error message.
The Restarts: area contains a list of available restarts. To invoke a restart, select it in the list and press OK , or double-click on it in the list.
The row of buttons at the bottom of the Notifier window operate as follows:
Prompts for basic information about the bug and then creates an Editor tool containing a template bug form with a stack backtrace and other information. Use this if you believe you have found a bug and wish to report it to Lisp Support. Visit
www.lispworks.com/support/bug-report.html
for more information about reporting bugs.
Raises a Debugger tool, as described earlier in this chapter.
Invokes the abort restart.
Invokes the restart which is selected in the Restarts: list.
Some processes cannot be debugged in the LispWorks IDE. Errors in these processes are handled slightly differently in the Notifier window which has these two buttons:
Creates a snapshot Debugger. This contains a copy of the stack backtrace which you can examine as described in this chapter. However it is less interactive in that you cannot take any restart or return from a frame. For more information see "Snapshot debugging of startup errors" in the LispWorks User Guide and Reference Manual .
Creates an Editor tool containing the stack backtrace.
In this case there is no Debug button.