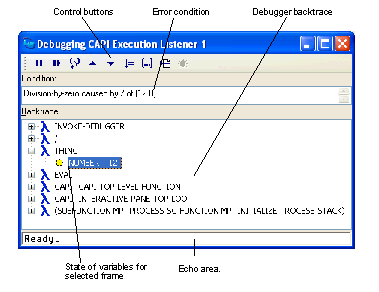


By default the debugger tool appears as shown in Debugger tool below.


The debugger tool has two areas, and a toolbar. These are described below. If you invoke the debugger tool by clicking Debug in a notifier window, the tool also contains a listener pane. This provides you with a useful way of evaluating Common Lisp forms interactively in the context of the error.