foo
into the Trace pane of the Tracer and pressing
Return
or clicking the  button. Do the same for
bar
.


This section shows an example of tracing two functions and examining the output.
Define the following functions
(defun foo (x y) (bar y x))
(defun bar (x y) (values (vector x y) (list y x)))
in a Listener and start the Tracer tool. The trace these functions by entering
foo
into the Trace pane of the Tracer and pressing
Return
or clicking the  button. Do the same for
bar
.
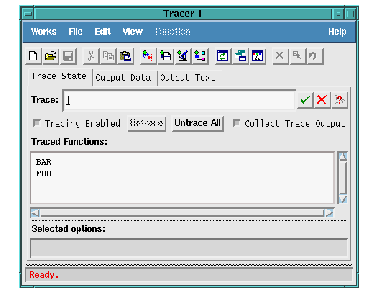
Figure 11.1 The Trace State view showing
bar
and
foo


(foo 100 200)
in the Listener. You will see output something like this printed in the Listener.
CL-USER 1 > foo 100 200
0 FOO > ...
>> X : 100
>> Y : 200
1 BAR > ...
>> X : 200
>> Y : 100
1 BAR < ...
<< VALUE-0 : #(200 100)
<< VALUE-1 : (100 200)
0 FOO < ...
<< VALUE-0 : #(200 100)
<< VALUE-1 : (100 200)
#(200 100)
(100 200)
CL-USER 2 >
Note: the format of the output is affected by the value of
*trace-verbose*
.
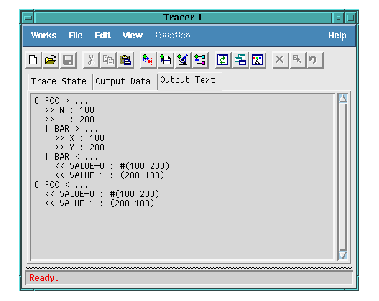
Now switch to the Output Text view of the Tracer and you will similar output.
Figure 11.2 The Output Text view


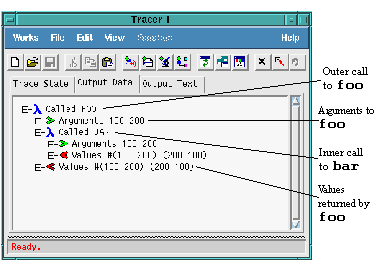
Now switch to the Output Data view of the Tracer, which will looks like this
Figure 11.3 The Output Data view


The node that is labeled
Arguments 100 200
contains the arguments to the function
foo
. Double-click on this node to show those arguments in an Inspector.
The first node that is labeled
Values #(200 100) (100 200)
contains the values returned by
bar
. Expand this node to reveal the two values. Double-click on one of the values nodes to inspect it. You can also see that these values were in turn returned by
foo
, as shown by the second node that is labeled
Values #(200 100) (100 200)
.