 in the LispWorks toolbar.


The Profiler provides a way of monitoring Lisp functions during the execution of your code. It is likely that you can make your code more efficient using the data that the Profiler displays.
The Profiler helps you to identify functions which are called frequently or are particularly slow. You should concentrate your optimization efforts on these routines.
The Profiler gives you an easy way of choosing which functions you wish to profile, which code you want to run while profiling, and provides you with a straightforward display of the results of each profile.
To create a Profiler, choose
Window > Tools > Profiler
or click  in the LispWorks toolbar.
In the next two sections we assume you are profiling a call to the function
foo
defined as follows:
(in-package "CL-USER")
(defun baz (l)
(dotimes (i l)))
(defun quux (l)
(dotimes (i l)))
(defun bar (n l)
(dotimes (i n)
(baz l))
(dotimes (i n)
(quux (floor l 2))))
(defun foo (n l)
(bar n l))


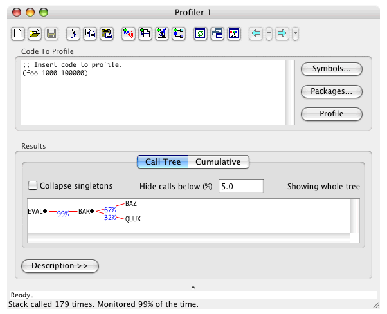
The Code to Profile panel lets you set up and profile any amount of Lisp source code.
The Results area is used to display the results of a profile, described in detail in Display of Profiler Data.
The Description area optionally shows a description of a function in the profile data. You can show the description by clicking on the Description >> button. The name, function object, lambda list, documentation string and source files of the selected function are displayed. The context menu in the description area allows further operations. Hide the description area if you wish by clicking on the Description << button.
The Echo area allows interaction with editor commands, as in other tools.
The bottom pane of the Profiler displays a summary of the last profile performed.